Google Search Console (GSC) is a free tool that shows how Google crawls and indexes your website and how your pages perform in organic search results. It is one of the most valuable SEO tools available and is completely free. This guide covers the key reports you need to know and how to use them.
How do you set up Google Search Console?
Go to search.google.com/search-console and sign in with a Google account. Add a new property by entering your website's URL. Google offers two property types: Domain (covers all subdomains and protocols, verified via DNS) and URL prefix (covers a specific URL, verified via HTML file, meta tag, Google Analytics, or Google Tag Manager). Once verified, data begins populating within 24 to 48 hours, though historical data for up to 16 months becomes available over the following days.
What does the Performance report show?
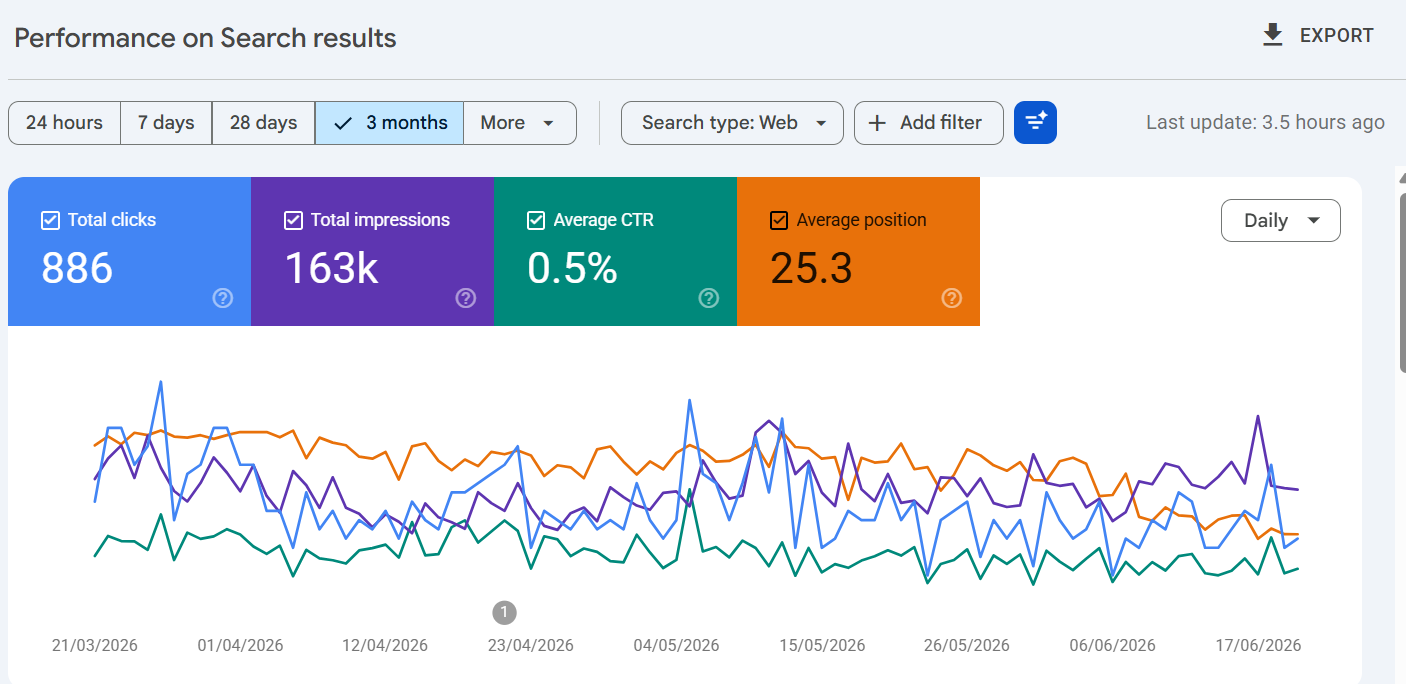
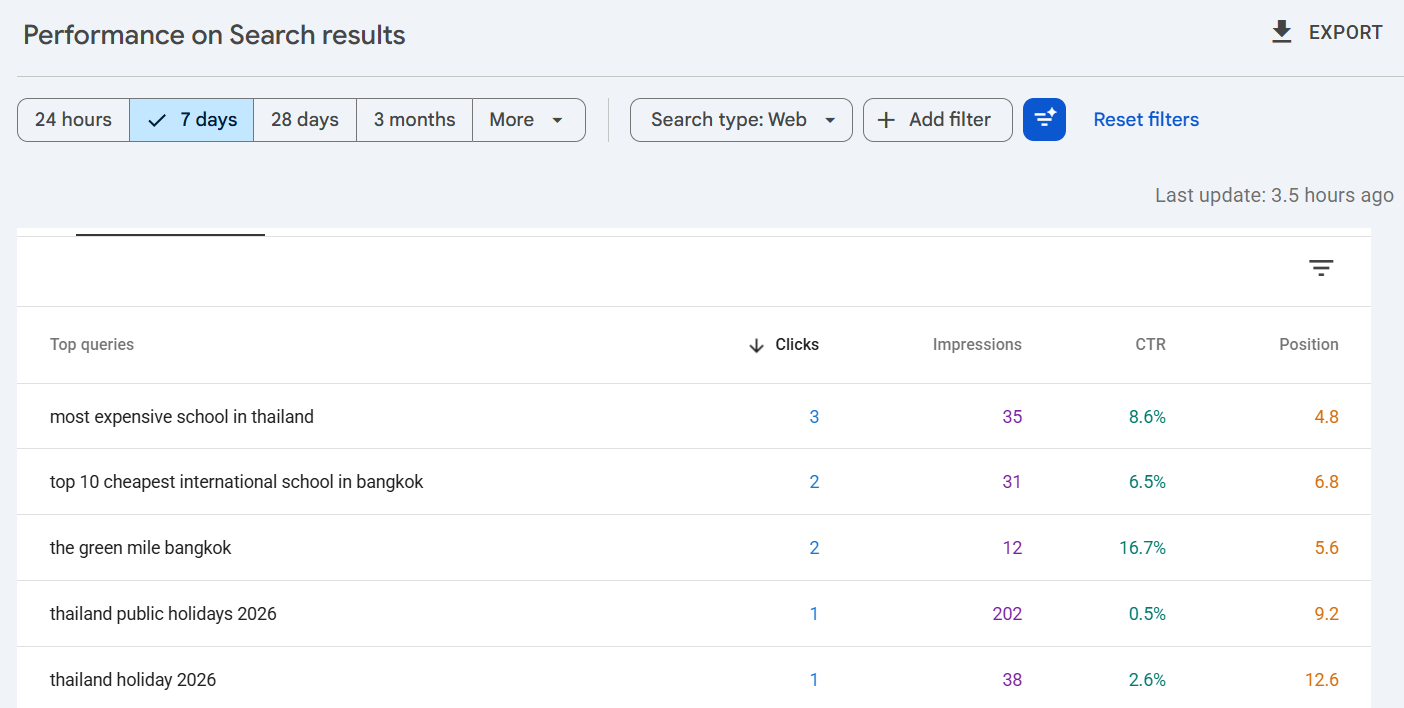
The Performance report is the most used section of GSC. It shows four key metrics for your site's organic search performance: total clicks (how many times users clicked through to your site from search results), total impressions (how many times your pages appeared in search results), average click-through rate (CTR), and average position (your average ranking across all queries). You can break this data down by query (search term), page, country, device, and date. The queries report is particularly useful for identifying which keywords your pages are ranking for and where there is opportunity to improve CTR or position.
What is the Coverage and Indexing report?
The Indexing report (formerly Coverage) shows which pages on your website have been indexed by Google and flags any errors or warnings preventing pages from being indexed. Key statuses to monitor are:
- Error: pages that Google tried to index but could not, due to issues such as 404 errors, server errors, or redirect loops
- Valid with warning: pages that are indexed but have an issue worth reviewing, such as pages indexed despite a noindex tag being present
- Excluded: pages Google chose not to index, often correctly (duplicate pages, canonicalised pages) but sometimes requiring review
What other reports are worth checking regularly?
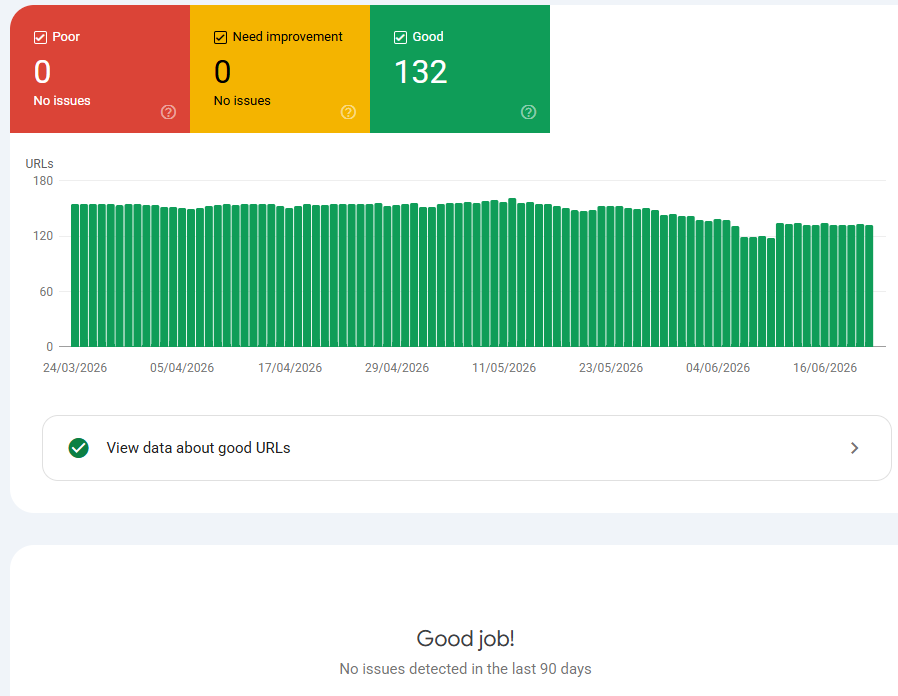
The Core Web Vitals report shows real-world performance data for page speed, flagging URLs that fail Google's LCP, CLS, and INP thresholds. The Sitemaps section lets you submit your XML sitemap directly to Google. The Links report shows which pages have the most internal and external backlinks pointing to them.
The Manual Actions section alerts you if your site has received a penalty from Google's spam team, which would require remediation before rankings could recover. For businesses in Thailand managing both Thai and English content, GSC's country and language breakdown in the Performance report is particularly useful for separating local Thai organic performance from international traffic.